 |
| The Golden Gate Bridge San Francisco, California govexec.com |
We are already into 2015 but it is still not too late to look back at America's best performing cities in 2014. To help us with deciphering which cities performed best and why is Richard Florida and hist article "America's Best Performing Cities in 2014." Mr. Florida tell us, "The Economist reported this month that 2014's third quarter saw a 5 percent GDP growth, the fastest pace since 2003." However, at the risk of stating the obvious, recovery has been disproportionately uneven, benefitting the affluent while the working and middle class fall further behind. Recovery has been disproportionately felt throughout cities and metropolitan areas, the real engines of economic growth. Proof of this phenomenon is found in the Milken Institute's Best-Performing Cities 2014 (http://www.milkeninstitute.org/publications/view/682), released on January 8, 2015. This is an "...outcome-based rankings, the study rates some 200 large and 179 small metro on several key measures: job-growth, wage and salary growth and the size and concentration of high tech industry." The study also revealed that the recovery has been centered on "...the twin pillars of America's knowledge/energy economy with the best performers being energy centers and tech hubs."
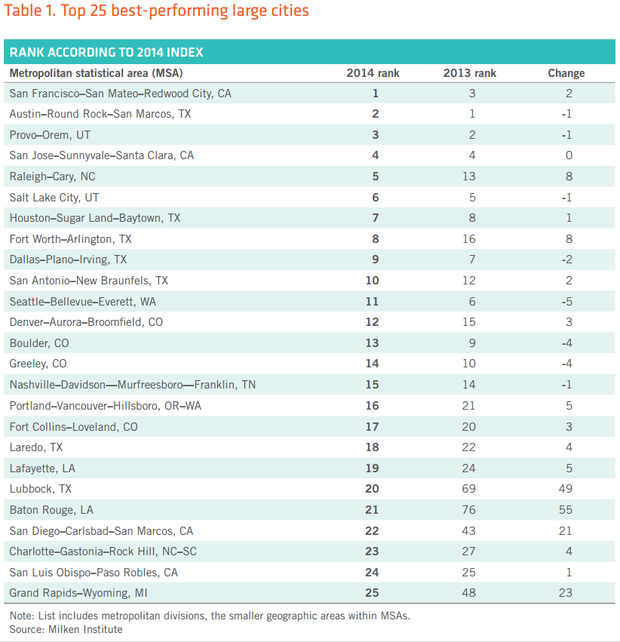 |
| Top 25 best-performing cities citylab.com |
At the top of the list of best-performing cities is San Francisco, which improved on its number three standing in 2013. What this tells us is that the "City by the Bay's" rise to the top is another indication of its ongoing move toward urban tech. Mr. Florida observes, "...this is the first time that San Francisco has topped the list in its 15-year history, outdistancing Austin, last year's top performer (now number two), and San Jose, in the heart of Silicon Valley (fourth place)." In an email to Mr. Florida, study author Ross DeVol wrote,
From 2008 to 2013, professional, scientific, and technical services created 25,500 jobs in San Francisco-45 percent of total job creation over that period! The median wage for these professions was $91,400." (Ibid)
To give you an indication how Technology-based professions played such a key role in city performance, the top six finishers were all tech hubs: the afore mentioned, Provo, Utah; Raleigh-Cary in North Carolina's Research Triangle; and Salt Lake City. The remaining top ten were four Texas cities: Houston, Fort Worth, Dallas, and San Antonio. Seattle came in at number eleven and Boulder, Colorado was number thirteen.
Energy centers also ranked high on the list. The evidence is strongest in the metropolitan ares in Texas, home to seven of the top twenty-five best performing metropolitans. The energy economies of Lafayette and Baton Rouge, Louisiana also found their way into the top twenty-five-Baton Rouge had the biggest jump, fifty-five places to number 21.
 |
| "Rust Belt Rising" theheadandthehead.com |
The Sunbelt metropolitans, once infamous capitals of sprawl and housing "growth without growth." continued lag behind: Phoenix, Arizona (65) and Las Vegas, Nevada (144). The three largest metropolitans did not fare too well: New York (62), Los Angeles (42), and Chicago (97). The greater Washington D.C. area, which did well during the recession, fell from 45th in 2013 to 84th in 2014.
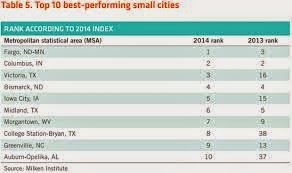 |
| Top ten best-performing small cities citylab.com |
 |
| Biggest gainers among large MSAs citylab.com |
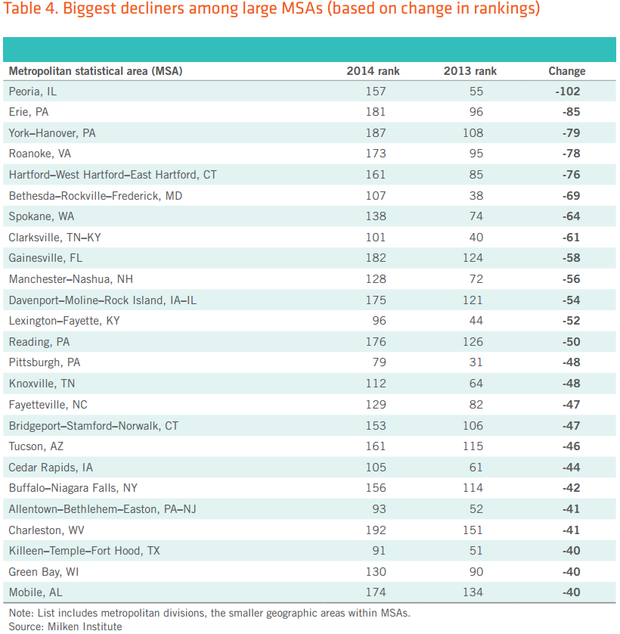 |
| Biggest decliners among large MSAs citylab.com |
To some extent , longer-term subpar growth trends are reemerging, after having been masked during the Great Recession. Most of these metros have more service-based economies that didn't experience as severe a decline as many with with a greater reliance on manufacturing. (Ibid)
 |
| Cover of 2014 Best-Performing Cities bizneworleans.com |
Richard Florida writes, "Economist have increasingly argued that talent and human capital are key drivers of regional economic performance. And Milken's rankings show a reasonably close association with the share of adults that are college grads (.32) and the share of the labor force made up of knowledge, professional, and creative workers (.23)." More interesting, the Milken Index is closely aligned with arts and cultural talents (.35) than science and technology workers (.30) and business professional (.24). Mr. Florida continues, "And for all the talk of how 'eds and meds' can help spur development, the Milken Index is negatively associated with 'eds and meds' occupations (-.17). This reflects what the venture capitalist Fred Wilson told me in an interview a while back: He sees tech startups shifting from their previous engineering and hardware orientation to a broader, more urban focus, where entrepreneurs have characteristics that more similar to artists."
 |
| Map of America's Best Performing Cities 2014 builderonline.com |
The results tell us about "the connection between clustered and concentrated tech-driven economies and inequality..." This may sound odd to some of you but the Milken Index revealed that metropolitans that fare better have higher levels of inequality (a .28 correlation; down from .34 in 2013). One point to pay attention to is the Milken Index inequality measure is not statistically associated with income inequality measured by the Gini coefficient. What is particularly worrisome to Mr. Florida and others is the increasing cost of housing threatening the flourishing creative centers. Charlotta Mellander's study concluded that there was no "statistical association between the Milken Index and the share of income devoted to housing." Richard Florida does concede that housing affordability is very much a serious problem in cities such as San Francisco and New York, the upside is that this not the universal situation for high-performing cities and metropolitans.
The takeaway from the Milken Index is that it presents a better picture of "...America's geographically uneven recovery, where tech hub and energy centers prosper while older manufacturing and construction driven metros continue to falter." However, before you start looking at housing and employment opportunities in San Francisco be forewarned that there are dark clouds looming in the horizon. "Falling energy prices will likely put a damper on growth in many energy-driven metros. And leading urban tech centers like San Francisco are faced with rising housing prices and mounting inequality which threaten to price out some of the very people who have driven innovation there in the first place." To find out how these factors will affect cities and metropolitans, we will have to wait for the 2015 rankings.
No comments:
Post a Comment